Viz Page Viz
https://www.youtube.com/embed/Fm0hpkxsZoo
code sample
-
spdump.py
import sqlite3 conn = sqlite3.connect('spider.sqlite') cur = conn.cursor() cur.execute('''SELECT COUNT(from_id) AS inbound, old_rank, new_rank, id, url FROM Pages JOIN Links ON Pages.id = Links.to_id WHERE html IS NOT NULL GROUP BY id ORDER BY inbound DESC''') count = 0 for row in cur : if count < 50 : print(row) count = count + 1 print(count, 'rows.') cur.close() -
spjson.py
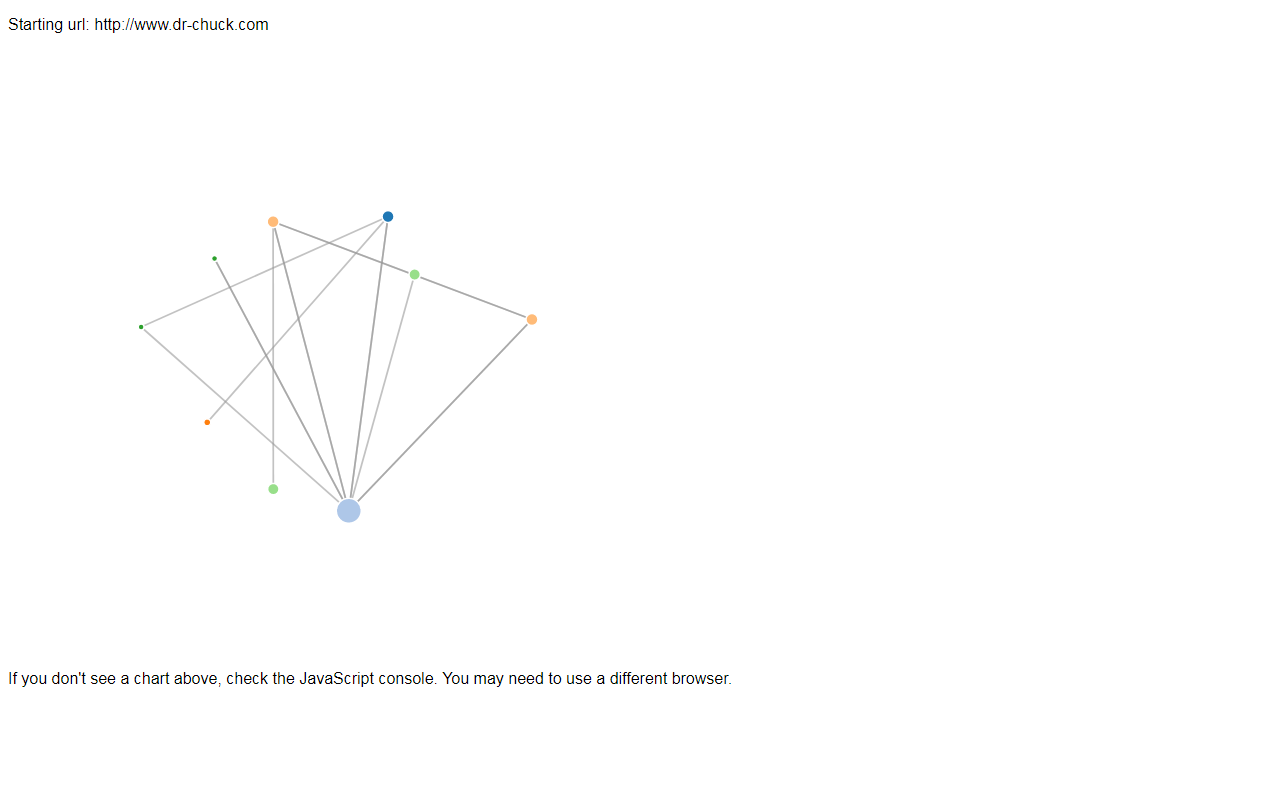
import sqlite3 conn = sqlite3.connect('spider.sqlite') cur = conn.cursor() print("Creating JSON output on spider.js...") howmany = int(input("How many nodes? ")) cur.execute('''SELECT COUNT(from_id) AS inbound, old_rank, new_rank, id, url FROM Pages JOIN Links ON Pages.id = Links.to_id WHERE html IS NOT NULL AND ERROR IS NULL GROUP BY id ORDER BY id,inbound''') fhand = open('spider.js','w') nodes = list() maxrank = None minrank = None for row in cur : nodes.append(row) rank = row[2] if maxrank is None or maxrank < rank: maxrank = rank if minrank is None or minrank > rank : minrank = rank if len(nodes) > howmany : break if maxrank == minrank or maxrank is None or minrank is None: print("Error - please run sprank.py to compute page rank") quit() fhand.write('spiderJson = {"nodes":[\n') count = 0 map = dict() ranks = dict() for row in nodes : if count > 0 : fhand.write(',\n') # print row rank = row[2] rank = 19 * ( (rank - minrank) / (maxrank - minrank) ) fhand.write('{'+'"weight":'+str(row[0])+',"rank":'+str(rank)+',') fhand.write(' "id":'+str(row[3])+', "url":"'+row[4]+'"}') map[row[3]] = count ranks[row[3]] = rank count = count + 1 fhand.write('],\n') cur.execute('''SELECT DISTINCT from_id, to_id FROM Links''') fhand.write('"links":[\n') count = 0 for row in cur : # print row if row[0] not in map or row[1] not in map : continue if count > 0 : fhand.write(',\n') rank = ranks[row[0]] srank = 19 * ( (rank - minrank) / (maxrank - minrank) ) fhand.write('{"source":'+str(map[row[0]])+',"target":'+str(map[row[1]])+',"value":3}') count = count + 1 fhand.write(']};') fhand.close() cur.close() print("Open force.html in a browser to view the visualization") -
force.js
var width = 600, height = 600; var color = d3.scale.category20(); var dist = (width + height) / 4; var force = d3.layout.force() .charge(-120) .linkDistance(dist) .size([width, height]); function getrank(rval) { return (rval/2.0) + 3; } function getcolor(rval) { return color(rval); } var svg = d3.select("#chart").append("svg") .attr("width", width) .attr("height", height); function loadData(json) { force .nodes(json.nodes) .links(json.links); var k = Math.sqrt(json.nodes.length / (width * height)); force .charge(-10 / k) .gravity(100 * k) .start(); var link = svg.selectAll("line.link") .data(json.links) .enter().append("line") .attr("class", "link") .style("stroke-width", function(d) { return Math.sqrt(d.value); }); var node = svg.selectAll("circle.node") .data(json.nodes) .enter().append("circle") .attr("class", "node") .attr("r", function(d) { return getrank(d.rank); } ) .style("fill", function(d) { return getcolor(d.rank); }) .on("dblclick",function(d) { if ( confirm('Do you want to open '+d.url) ) window.open(d.url,'_new',''); d3.event.stopPropagation(); }) .call(force.drag); node.append("title") .text(function(d) { return d.url; }); force.on("tick", function() { link.attr("x1", function(d) { return d.source.x; }) .attr("y1", function(d) { return d.source.y; }) .attr("x2", function(d) { return d.target.x; }) .attr("y2", function(d) { return d.target.y; }); node.attr("cx", function(d) { return d.x; }) .attr("cy", function(d) { return d.y; }); }); } loadData(spiderJson); -
force.html
<!DOCTYPE html> <html> <head> <title>Force-Directed Layout</title> <script type="text/javascript" src="d3.v2.js"></script> <script type="text/javascript" src="spider.js"></script> <link type="text/css" rel="stylesheet" href="force.css"/> </head> <body style="font-family: sans-serif;"> <script> document.write("<p>Starting url: "+spiderJson.nodes[0].url+"</p>"); </script> <div id="chart" style="border:1px"></div> <script type="text/javascript" src="force.js"></script> <p>If you don't see a chart above, check the JavaScript console. You may need to use a different browser.</p> </body> </html> -
force.css
  circle.node {
    stroke: #fff;
    stroke-width: 1.5px;
  }

  line.link {
    stroke: #999;
    stroke-opacity: .6;
  }
open HTML in a browser